
Your phone report says 14 calls were missed last week. It does not say how many callers heard a busy signal, left in the menu, or hung up on the voicemail greeting and never rang again.
Monday, reading the report
Friday, 4:50pm
the callers it never counted
Key takeaways
- A phone report counts the calls your system saw, so callers who heard a busy signal never appear in it.
- Missed, abandoned and blocked calls are three different things, and a phone report may show only the first.
- In a 2013-14 audit of a government phone service, 13.7 million of 56.8 million calls were blocked, about a quarter of the demand.
- Report the median and the 90th percentile of answer time, because an average buries the callers who hang up.
- Your count is a floor and not a total, so test it by ringing your own number before you work out what the gap costs.
Contents8
Open your phone system's weekly report and you will find a tidy number: calls received, calls answered, calls missed. It is probably accurate. The trouble is what it is accurate about.
A phone report describes the calls your system saw. The callers who never reached it, and the callers it recorded as something other than a loss, sit outside the number. This article is about those two groups, why they are bigger than they look, and what to ask for before you trust the figure on the page.
What a phone report actually counts
A phone report counts the calls your system received and records how each one ended. It has no way to count a call that never arrived, and it labels outcomes using its own definitions, which may differ from yours. Three terms carry most of the confusion: missed, abandoned and blocked.
A missed call rang and nobody picked up. An abandoned call is one where the caller hangs up after the call has entered the network, which in a practice would mean after it rang, after a menu, or while it was on hold. A blocked call is one where the caller hears a busy signal and cannot enter the network at all. The last two definitions are not ours. They come from the Australian National Audit Office, which wrote them for an audit of a government phone service [1], and they are the cleanest statement of the difference we have found.
The first of the three is the one the word "missed" suggests. The second shows up in a report only if the system logs a call that was ringing or queued when the caller left. The third cannot show up at all, because the call never reached the thing that produces the report.
That is also why a missed-call figure in a supplier's brochure cannot be set beside yours until you know which of the three it counts.
The audit that found a quarter of the calls missing
In 2013 to 2014 Centrelink's phone figure was 43.1 million calls. The Australian National Audit Office counted what callers actually dialled: 56.8 million. The other 13.7 million heard a busy signal and never entered the network, so no count of calls handled could include them. Roughly a quarter of the demand was invisible.
That is the headline, and the audit report sets out the rest [1]. Of the 43.1 million calls that did enter the network, about 45% were answered by a service officer and about a quarter were resolved in the automated menu. The Audit Office estimated that the remaining 30% were abandoned, meaning the caller hung up without resolving the reason for the call. Callers who gave up after joining the queue had waited an average of 9 minutes and 42 seconds.
There is a second lesson in the same audit. The department's data showed it had met its overall target for all customer phone services in each of the two preceding years, while Centrelink callers in particular were still experiencing high levels of blocking and abandonment [1]. A target met on paper says little about the caller.
Be careful with the comparison. This was a national welfare line taking around 800,000 calls a week, on a system built for that, and the figures are more than a decade old. Nobody should read 24% blocked (13.7 of 56.8 million) as a number for a dental practice. The point is the structure of the count. A tally of calls handled starts after the busy signal, a tally of calls answered starts after the hang-up, and every stage you leave out makes the next number look better.
A busy signal is not a missed call in anyone's report. As far as the system can tell, it never happened.
Where a practice's calls go missing
A practice has the same leaks at a smaller scale. Calls arrive faster than the lines or people can take them, callers leave in a menu or on hold, and voicemail may be counted as answered. Each outcome is recorded differently by different systems, so the report is only as honest as its settings.
The table sets out what the caller lived through and how a system may record it. The right-hand column is the one to take to your provider.
| What the caller experienced | How a system may record it | What to check |
|---|---|---|
| Rang out, nobody picked up | Missed or unanswered | Whether calls diverted to a mobile still count here |
| Heard a busy signal | Often not recorded, because the call never reached the system | How many calls can ring at once |
| Hung up in a menu | Handled by the menu, or abandoned | Whether a menu hang-up counts as a completed call |
| Hung up on hold | Abandoned, if the system logs it | Whether very short waits are left out |
| Reached voicemail, left no message | Answered, in some systems | How your report treats voicemail |
| Reached voicemail, left a message | Answered | Who calls back, and by when |
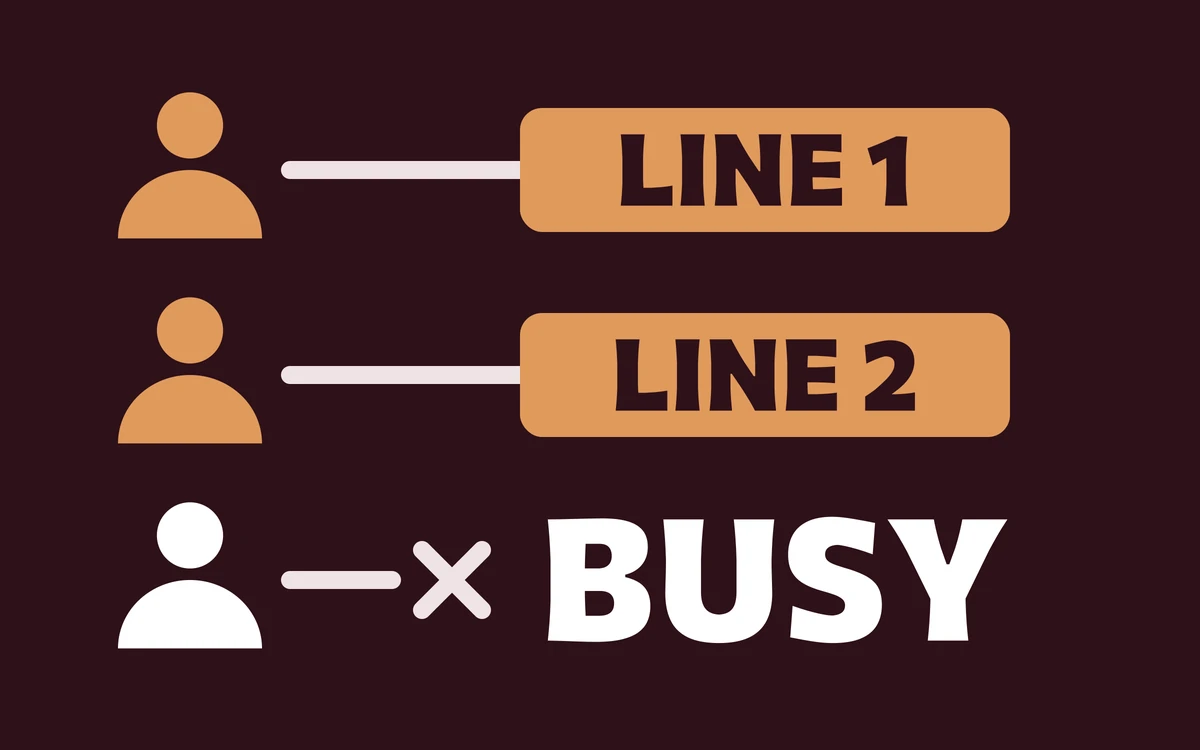
None of this is exotic. Settings like these exist in business phone systems, and the defaults were chosen by the vendor rather than by the practice. A small practice with two lines and one person on the desk can fill both lines with one call in progress and one on hold, and the third caller hears the busy tone. Nothing in the weekly report will say so.
Voicemail deserves its own mention, because it can flatter the numbers twice. If the system counts a voicemail pickup as answered, the answered figure rises and the callers who hung up on the greeting disappear into it. If someone returns the messages, the practice feels the problem is handled, but the report has no idea whether the callback happened or reached the patient.
Calls diverted to a mobile at lunch or after hours need a test of their own, because a diverted call may show as answered whether or not anyone picks up the mobile.
Why the average hides the callers you lose
An average answer time blends the good hours with the bad ones and reports a figure nobody experiences. The Audit Office made this point about Centrelink's 16 minute target: on the top ten Centrelink lines, 36% of callers waited under 10 minutes while some 30% waited more than 30 minutes. The mean sat between two very different experiences.
The same report held up the Australian Taxation Office as the better example, because it set its target as a share of calls answered within a stated time [1]. That is still how the ATO works. Its service commitments page, updated on 24 September 2026, states them as percentiles, for example that 95% of inbound general callers wait less than 40 minutes [2]. A caller can plan around a promise like that. An average cannot give them one.
A practice can borrow the idea without a contact centre. Instead of the average, report the median and the 90th percentile. Take ten calls answered after 5, 5, 8, 10, 12, 15, 20, 25, 90 and 180 seconds. The average is 37 seconds, which sounds fine. The median is 13.5 seconds and the 90th percentile is 90 seconds. Two of the ten callers waited a minute and a half or more, and the average hid both. Those numbers are invented to show the effect. The access audit guide shows how to build both figures from a month of call records.
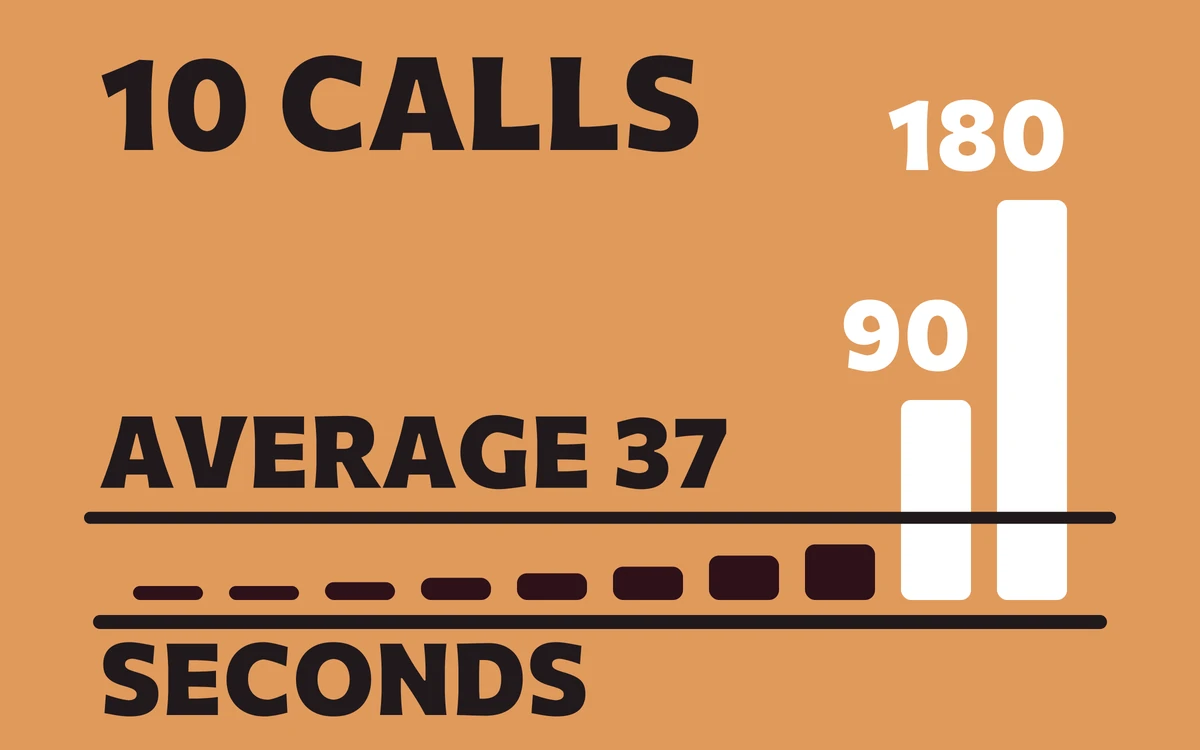
An average describes your good hours. The callers you lose are in the tail.
What to ask for before you trust the report
Before you trust a phone report, put five questions to the provider in writing: how many calls can ring at once, whether busy signals are counted, how answered and abandoned are defined, how voicemail and diverted calls are treated, and whether the report can be cut by hour. The answers sit in the settings.
- How many calls can ring at the same time?
- Are busy signals counted anywhere?
- How do you define answered and abandoned?
- How are voicemail and diverted calls treated?
- Can the report be cut by hour of the day?
The test is cheap and slightly dull. Ring your own number from a mobile at several times across a week, including the quiet end of the afternoon and the minutes just after opening, and write down what happens each time: how long it rang, whether you reached a person, a menu or voicemail, and whether you heard a busy tone. Then compare your notes with what the report says for the same hours.
Make three of the calls deliberate. Hang up on the fifth ring once, hang up in the menu once, and leave one voicemail. Then see how each appears in the report, if it appears at all. Treat the whole exercise as a smoke check rather than a survey: a handful of calls cannot give you a rate, and nobody should quote one from them. What they can tell you is whether the report and the experience agree.
Two outcomes are possible, and both are useful. If the report matches your notes, you have a number you can rely on and a baseline to improve. If it does not, you have found the size of the undercount, and every cost you were about to work out from the old figure was a minimum. Nobody needs to buy anything to learn that.
What the gap costs, and what it does not prove
A missed call is not a lost patient, and the report cannot say which one it was. Some callers ring back, some book elsewhere, and some were never going to book. What the gap does show is that your count is a floor and not a total, so any cost you build on it is a minimum.
National figures help with the size of the problem and say nothing about your phone. In its 2024-25 survey of people aged 15 and over, the Australian Bureau of Statistics found that 26.6% delayed or did not see a GP when needed, and that 25.2% delayed or did not see a dental professional when needed, including 16.1% because of cost [3]. The survey measures people, not calls. It tells you access is a live problem for a large share of the population, and nothing about how many of them rang you.
When you do put a cost on it, use the number you can defend. Take the test-adjusted figure as your estimate and the report's figure as your floor, and say which is which. Work out what a new patient is worth from your own books, not a brochure, and allow for the callers who ring back; the after-hours guide shows how to correct for patience.
Here is the arithmetic with invented numbers. Suppose the report shows 40 missed calls in a week. A week of test calls and a look at the provider's settings turn up another 10 callers who heard a busy signal and 8 who left in the menu. The practice's real figure is 58 calls, which is 45% higher than the number on the page. Those figures exist to show the sum. Yours will differ, and the gap may run either way.
Velaire sells an AI front office, so weigh this section knowing that. The measurement comes first whichever way you go, because a practice that has not counted cannot say whether anything fixed the problem. When you have your baseline, the missed call recovery service is one way to act on it. Start with the count.
Sources
- Australian National Audit Office, Management of Smart Centres' Centrelink Telephone Services, Auditor-General Report No. 37 of 2014-15, published 19 May 2015anao.gov.au
- Australian Taxation Office, Current year performance, service commitments, last updated 24 September 2026ato.gov.au
- Australian Bureau of Statistics, Patient Experiences, 2024-25 financial year, released 18 November 2025abs.gov.au