
Every practice believes it knows how patients get through to it. Almost none has measured it. This is the audit that replaces the belief with eight numbers you can act on.
at the desk
at 12:40pm, ringing out
What you will end up with
- Measure one ordinary month, not a memorable one. Every later figure is a rate and needs that denominator.
- Report time to answer as a median and a 90th percentile. A mean describes your good hours and hides the callers who hang up.
- Your genuinely covered window is smaller than your stated hours once lunch, waiting-room duty and diverts come out.
- The orphan callback is counted as a success by every phone system and as a failure by the patient.
- Price the gap in your own numbers, and sample twenty unanswered calls by hand rather than guessing what share were new patients.
Lessons13
Ask a practice manager how long a patient waits on the phone and you will get a number. Ask where the number came from and the conversation changes. It is almost always an impression formed at the desk, which is the one vantage point that cannot see the calls that never connected.
That blind spot is structural rather than careless. The desk experiences the calls it answers. It does not experience the patient who rang at 12:40, heard fourteen rings, and booked somewhere else, because from the desk's point of view that call did not happen. Every front-office belief a practice holds is assembled from the successful half of the evidence.
This guide is the audit that replaces the impression. Eight lessons, roughly four hours of work spread over a fortnight, and at the end you have eight figures about your own practice rather than eight opinions about it. None of it requires new software. Most of it is already sitting in your phone provider's portal, unlooked at.
It is written for Australian practices, and the comparison figures below are Australian. That matters more than it sounds: the access picture here is genuinely different from the one in the overseas material most front-office advice is written against, and a benchmark from the wrong country will tell you that you are fine when you are not.
What this produces, and what it will not fix
By the end you will have a call volume curve by hour, a time-to-answer figure, a list of the hours nobody covers, one enquiry followed end to end, and a costed view of the gap in your own dollars. Those are the outputs. They are deliberately unglamorous and they are the things a decision actually needs.
What it will not fix is a practice with no capacity. If your books are full for three weeks, improving how fast you answer converts a patient who would have given up into a patient who waits three weeks and is annoyed about it. Access work pays when there is somewhere for the answered call to go. Check that first.
It will also not fix a clinical bottleneck wearing a front-office costume. If every call takes eleven minutes because the person answering has to interrupt a clinician to get an answer, the phone is reporting a problem that lives elsewhere. Lesson 4 exists to catch that before you spend money on the wrong layer.
Access work converts unmet demand into booked demand. If there is no capacity to book into, the audit will produce a very clear picture of a problem you cannot currently solve.
The national picture is worth holding in your head as a reference, not a target. In 2024 to 2025, 26.0% of Australians reported waiting longer than they felt was acceptable for a GP appointment, down from 28.0% the year before [1]. Access is not uniform: in outer regional and remote areas that figure was 33.6%, against 24.6% in major cities [1]. And 26.6% of people delayed or did not see a GP when they needed to, an improvement on 29.2% the previous year but still more than one person in four [1].
Those numbers describe appointments, not phones. But they set the frame. A quarter of the population is already at the edge of giving up, and the phone is where most of them meet you first.
Count what actually arrives
Start with volume, because every later number is a rate and a rate without a denominator is decoration.
Pull one ordinary month of call records. Not December, not the fortnight around a public holiday, not a week when a clinician was away. You want a boring month, and the most common mistake here is choosing a memorable one.
From the raw log, produce four counts:
- Total inbound calls.
- Calls answered by a person.
- Calls that rang out, went to voicemail, or were abandoned by the caller.
- Calls outside your stated opening hours.
Most phone systems will give you the first three directly. The fourth usually needs a filter on the timestamp, and it is the one people skip. It is also where the interesting result lives.
Then break the total into hours of the day and days of the week. A spreadsheet with 24 rows and 7 columns is enough. You are looking for the shape, not the precision.
Expect two surprises. The first is that Monday is worse than you thought and the difference is larger than any other day-to-day gap. The second is that the busiest single hour is not the one your rostering assumes, and is frequently the hour immediately after opening rather than mid-morning.
- Total inbound calls for one ordinary month
- Calls answered by a person
- Calls that rang out, went to voicemail, or were abandoned
- Calls arriving outside your stated opening hours
- The same totals broken down by hour and by weekday
Set aside about 90 minutes for this lesson the first time. Every repeat takes closer to 20 minutes, because the hard part is deciding what to count and that decision stays made.
Two definitions need settling before you count anything, and settling them badly is how an audit quietly becomes useless.
The first is what counts as a call at all. Most systems log every inbound leg, which means one patient who rang, was transferred, and rang back after being cut off appears three times. If you are measuring demand you want unique attempts. If you are measuring load on the desk you want legs. Pick one, write it at the top of the sheet, and never mix them in the same table.
The second is what counts as answered. A call picked up by an auto-attendant is answered by the system and not by the practice, and lumping the two together is the most common way a practice reports a 96% answer rate while patients complain they cannot get through. Count human answers separately from system answers from the first day, because retrofitting the split later means recounting the month.
While you are in the log, note the distribution of call length as well as the count. A cluster of very short answered calls, under about 20 seconds, is usually not a cluster of efficient interactions. It is a cluster of callers who reached a system, heard a menu, and hung up, or a desk that answered and immediately put people on hold. Either way it is volume that looks like success in the totals.
Time the answer
Volume tells you how much. This tells you how it felt.
There are three distinct figures here and practices routinely conflate them, which is why the answer is usually wrong:
| Figure | What it measures | Where it hides |
|---|---|---|
| Time to answer | Ring start to a human speaking | Averaged across the day, which flattens the peak |
| Time in queue | Answered by a system, then waiting | Often not logged at all |
| Time to resolution | Answer to the caller's need being met | Almost never measured |
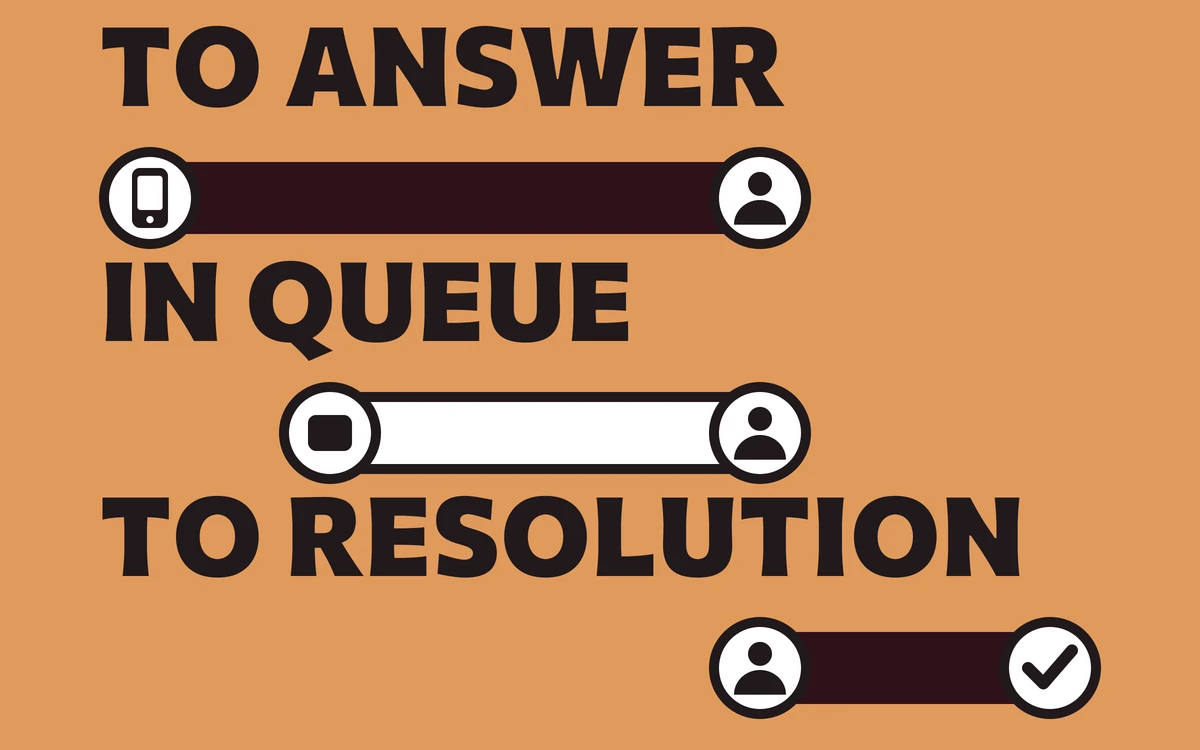
Report time to answer as a median and as a 90th percentile, never as a mean alone. A mean is dragged down by the many quick answers at quiet times and will tell you everything is fine while a quarter of your callers wait through something quite different. The 90th percentile is the number that describes the experience of the people most likely to hang up.
Do the same split by hour that you did in lesson 1. A practice with an acceptable median and a terrible 11am is a rostering problem with a simple fix. A practice with a terrible median everywhere is a capacity problem and needs a different conversation.
Report the median and the 90th percentile. A mean answer time is the single most misleading number in front-office reporting.
If your system genuinely cannot report any of this, measure it by hand for one week. Someone notes the time the phone starts ringing and the time they pick up, for every call. It is tedious and a week of it is enough. An imperfect measured number beats a confident invented one.
There is a third figure worth capturing while you are here, and it is the one that predicts complaints better than either of the others: the abandonment point. For the calls that were abandoned, how long had the caller waited before they gave up?
This matters because abandonment is not evenly distributed across time. There is usually a cliff. Below it almost nobody hangs up; above it, most people do. Practices that find their cliff discover that the fix is not "answer faster" in general but "answer faster than one specific number", which is a far cheaper target to hit and a far easier one to explain to a roster.
Be careful about one artefact here. If your system sends unanswered calls to voicemail after a fixed number of rings, your abandonment data is censored at that point: you cannot observe anyone who would have waited longer, because the system stopped them. A cliff that lands suspiciously close to your voicemail threshold is probably the threshold rather than patient behaviour. Note the threshold next to the figure so the next person reading it knows.
Finally, resist the urge to set a target during this lesson. You are still measuring. A target chosen before the distribution is understood tends to be the first round number that sounded reasonable in the meeting, and it will then distort every later decision by making the wrong hours look acceptable.
Find the hours nobody covers
This is the lesson that usually changes someone's mind, and it is arithmetic rather than insight.
Take your stated opening hours. Now subtract lunch, subtract the periods when the person on the phone is also managing the waiting room, and subtract any time the phone is diverted. What is left is your genuinely covered window. For most practices it is meaningfully smaller than the hours on the front door, and nobody has ever written the real number down.
Now overlay the volume curve from lesson 1. You are looking for three things:
- Volume inside covered hours that still rang out. A staffing or process problem.
- Volume in the uncovered gaps inside the working day. Lunch is the usual culprit and the usual surprise.
- Volume entirely outside opening hours. The part most practices assume is near zero.
- Inside covered hours, still rang outA staffing or process problem. The cheapest to fix and the most often missed.
- The gaps inside the working dayLunch is the usual culprit and the usual surprise. Patients ring when they can.
- Entirely outside opening hoursThe part assumed to be near zero. Count it before dismissing it.
- What is leftYour genuinely covered window, which is smaller than the front door claims.
That third category is worth a careful look before you dismiss it. Patients ring when they can, which for working people means early, late, and at lunch, which is exactly when practices are least able to answer. If your after-hours count is genuinely negligible, you have learned something useful and cheaply. If it is not, you have found demand you are currently declining without ever deciding to.
There is a trap in counting after-hours volume, and it flatters the practice. A patient who rings at 7pm, gets nothing, and rings again at 9am appears in your data as a successful morning call. The evening attempt is recorded as a ring-out and forgotten. So the morning peak you found in lesson 1 is partly displaced evening demand, and the after-hours count understates the real interest by exactly the number of people patient enough to try twice.
You can measure the displacement roughly. Take the after-hours ring-outs for a week, and check how many of those numbers appear again in the following morning's answered calls. The share that reappear is your patience rate. The share that do not is the group you lost, and they are the ones worth costing in lesson 5.
Worth noting what the uncovered window is not. It is not an argument for extending opening hours, which is expensive and usually unnecessary. Covering an hour is a different decision from staffing it, and the two get conflated constantly in these conversations. Lesson 6 is where that distinction gets made properly; here you are only establishing whether there is anything in the gap worth covering at all.
Follow one enquiry end to end
Numbers tell you where to look. This lesson tells you what is actually happening, and it is the only qualitative step in the guide.
Pick one ordinary new-patient enquiry, ideally one that was not straightforward, and trace it from first contact to resolution. Write down every step, every handoff, and every wait. Include the parts that happen away from the phone.
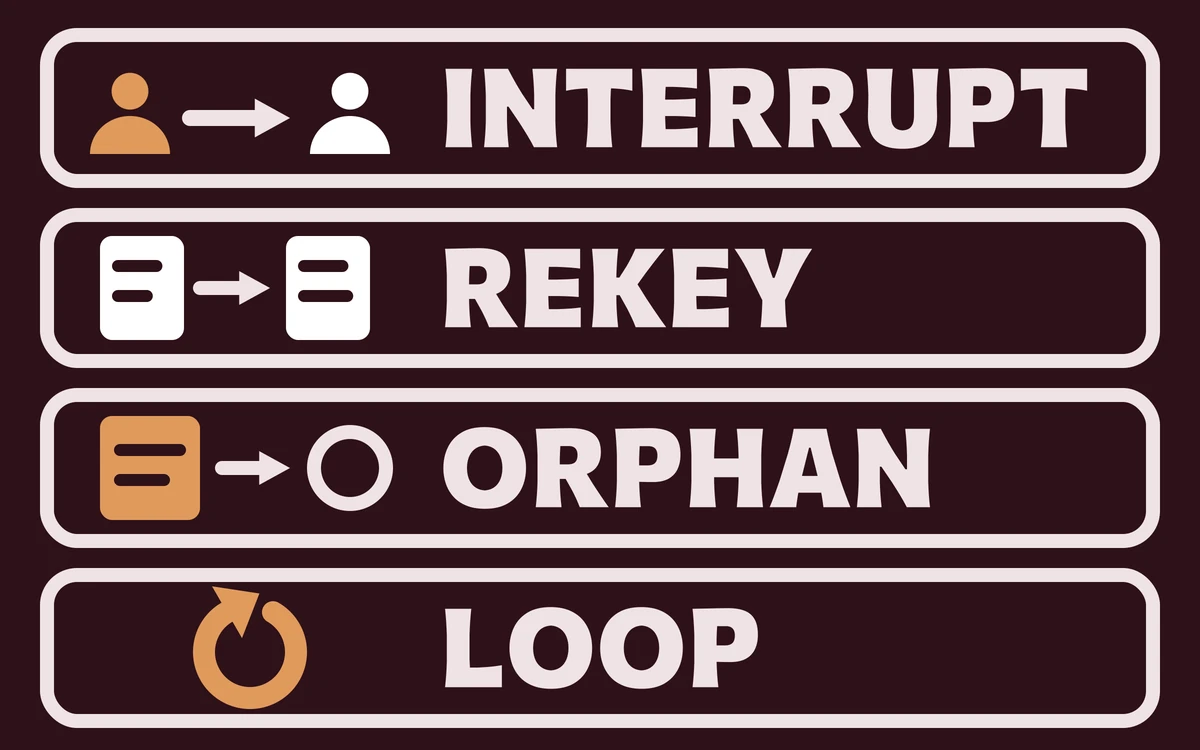
You are looking for four failure patterns. Walk the trace once for each:
- The interrupt. The person answering cannot resolve the call without interrupting a clinician, so either the caller waits or the clinician does. Mark every point where the trace leaves the desk.
- The rekey. The same information is typed twice, once into a note and once into the system, and the two disagree by the end of the week. Mark every place the same fact is written down again.
- The orphan. A call that ends with someone meaning to ring back, held in a head rather than a queue. Mark every promise that has no record behind it.
- The loop. A caller who rings three times about the same thing because nothing visible happened after the first two. Mark every repeat contact from the same number.
The orphan is the expensive one, and it is invisible in every report you will run. It looks like a successfully answered call, because it was one.
An answered call that ends in a promise nobody recorded is counted as a success by every phone system in the world, and as a failure by the patient.
Half an hour with whoever answers the phone will surface more of these than a week of log analysis. Ask them what the annoying calls have in common. They will know.
Ask three specific questions rather than inviting general comment, because general comment produces a list of grievances and specific questions produce a process map.
The first: what do you have to stop doing to answer the phone? The answer describes your real coverage far better than the roster does, and it is usually a job that then runs late, which pushes cost somewhere invisible.
The second: what calls do you dread? Dread is a reliable signal for a call type where the person answering lacks either the information or the authority to resolve it. Both are fixable and neither is a staffing problem.
The third: what do you write down, and where does it go? This is how you find the orphans. If the answer involves a sticky note, a diary, or a memory, you have located them precisely.
Do this conversation before you show anyone the numbers from lessons 1 to 3. Once people have seen a chart of unanswered calls, the conversation becomes about defending the chart, and you lose the account of what actually happens.
Price the gap in your own numbers
Now put a figure on it, using your own costs rather than anyone else's benchmark.
You need two inputs. The first is what an hour of front-desk time costs you, which you already know or can get from payroll in five minutes. If you want a reference point for sanity-checking, median hourly earnings across all Australian employees were $42.90 in August 2025, and median weekly earnings were $1,425 [2]. That is an all-occupations figure and not a front-desk rate, so use it to check that your own number is in a plausible range, not as a substitute for it.
The second input is what a new patient is worth to you over a reasonable horizon. Most practices have this or can estimate it within a wide band. A wide band is fine here, because the arithmetic below is not sensitive to it.
| Input | Where it comes from | Typical failure |
|---|---|---|
| Front-desk hourly cost | Payroll | Using a national average instead of yours |
| New patient value | Practice records over 12 months | Counting revenue rather than contribution |
| Unanswered calls per month | Lesson 1, count 3 | Including internal and supplier calls |
| Share of those that were new patients | Sampling 20 of them by hand | Assuming rather than sampling |
That last row is the one to do properly. Take twenty unanswered calls, look up the numbers, and find out how many were new enquiries as opposed to suppliers, wrong numbers, or existing patients who rang back successfully twenty minutes later. The proportion is almost never what people guess, and applying a guessed proportion to a real volume produces an authoritative-looking number that is wrong.
The output is a monthly figure with a stated range. Write down the assumptions next to it. In six months somebody will ask where the number came from, and the answer needs to be better than a remembered conversation.
State the range honestly and resist narrowing it. A figure presented as "somewhere between $3,000 and $9,000 a month, and here is exactly why the band is that wide" survives scrutiny. A single confident number does not survive the first person who asks how the new patient value was derived, and when it collapses it takes the credibility of the whole audit with it.
Two adjustments are worth making before you present anything.
Subtract the patience rate from lesson 3. Patients who rang back and got through are not lost, and counting them as lost is the single fastest way to have your figure dismissed by anyone who understands the phones. What they represent is friction and risk rather than direct loss, and they belong in the write-up as exactly that.
Then separate the recoverable from the structural. Calls missed at lunch are recoverable with a rostering change that costs very little. Calls missed at 8pm are structural and cost something real to cover. A single blended figure invites the response that the whole thing is too expensive to fix, when in practice a meaningful share of it is nearly free.
One caution on the value side. Use contribution rather than revenue. A new patient who generates $900 of revenue at 30% contribution is worth $270 to the decision, and building a business case on the $900 produces a number that is roughly three times too flattering and will not survive contact with whoever approves spending.
Decide what gets answered by whom
Only now is it worth deciding what changes, because only now do you know what you are changing.
Sort your call types into three buckets by what they actually need:
- Needs a person, now. Clinical questions, anything distressing, anyone who asks for a person. This bucket never shrinks and should never be automated. It is the bucket that justifies the other two existing.
- Needs an answer, not a particular person. Opening hours, location, parking, what to bring, whether you are taking new patients. Routine, repetitive, and the bulk of the volume in most practices.
- Needs an action with a record. Booking, rescheduling, a callback request, a message to a clinician.
The middle bucket is where front-office time goes and where almost none of the value is. The third is where the orphans from lesson 4 come from.
| Measure | Bucket | What it needs |
|---|---|---|
| Needs a person, now | Clinical, distressing, or asked for a person | Never automate. This bucket justifies the others |
| Needs an answer | Hours, location, parking, taking new patients | Most of the volume, almost none of the value |
| Needs an action with a record | Booking, rescheduling, callback, message | Where the orphans come from |
Be honest about the first bucket when you size the other two. A practice that automates its way into a caller with a clinical worry being handled by anything other than a person has not improved access, it has moved a risk. Our own position on this is written up in what we will not do, and it is deliberately a refusal rather than a feature.
If you are weighing outside help for the middle bucket, the vendor checklist covers the questions worth asking before anything is signed, and our pricing is published rather than quoted so you can do this arithmetic without a sales call.
Sizing the buckets takes about an hour and needs a sample rather than a theory. Take fifty consecutive calls from an ordinary day and tag each one. Do not tag from memory and do not tag from the call type field in your system, which records what was selected rather than what happened.
The result usually surprises people in the same direction. The middle bucket is larger than expected, frequently around half of all volume, and the first bucket is smaller than the anxiety about it suggests. That asymmetry is the entire commercial case for changing anything, and it is also the reason to be careful: a bucket that is small in volume can still be the one that matters most, and clinical calls are exactly that.
There is one rule worth fixing before any of this is implemented. Whatever handles the middle bucket must have an unconditional route to a person, available at any point, without the caller having to ask twice or navigate back through a menu. Not as a fallback for failure, but as a standing option. A caller who wants a human and cannot reach one has had a worse experience than a caller who waited, and no efficiency gain compensates for it.
Write the rules down
An audit that ends in a shared understanding ends in nothing. The output of this lesson is a single page.
It should state, in plain language:
- Which calls must reach a person, with no exceptions and no judgement call required.
- What happens to a call outside covered hours.
- Who owns a callback, and where it is recorded so it is not held in a head.
- How long a callback may wait before it escalates, as a number of hours.
- What a caller is told about when they will hear back, and who is accountable for that being true.
- What is never said on the phone, including anything clinical the person answering is not qualified to say.
Point 6 deserves care in an Australian practice. Before any of this extends into text or email, check what your own privacy and messaging obligations require of you, and get that reviewed by someone qualified rather than inferred from an overseas template. The rules that apply to a patient's contact details and to unsolicited messages are not the same rules that apply overseas, and front-office advice written for another market routinely gets this wrong in a direction that looks harmless and is not.
The page should fit on one side of A4. If it runs to three pages it will not be read, and an unread rule is indistinguishable from no rule while being more expensive to produce.
Give the callback rule in point 4 a number rather than a sentiment. "Same day" is a sentiment and means nothing at 4:55pm. "Within four working hours, and if that is not possible the patient is told so before the four hours elapse" is a rule, and it can be checked. The second clause is the part that matters: most callback complaints are not about the delay, they are about the silence during it.
Name the owner in point 3 as a role, not a person. Roles survive annual leave. A rule that says Sarah owns callbacks stops working the week Sarah is away, and it stops working silently, which is how a fortnight of orphans accumulates before anyone notices.
Put a review date on the page. Six months is about right. Without one the page becomes an artefact that describes a practice that no longer exists, and the first person to notice the drift will conclude the whole document is decorative.
Write the one page before you change anything. A process that exists only as a shared understanding degrades to nothing within about six weeks of the person who understood it going on leave.
Re-measure, and compare like for like
Wait a full month after any change, then run lessons 1 and 2 again. Not a fortnight, and not the fortnight immediately after, because both of those measure the novelty of the change rather than the change.
Three rules make the comparison honest:
- Same month shape. Compare an ordinary month to an ordinary month. A month containing a public holiday against one that does not will show you a change that is the calendar.
- Same definitions. If you tightened what counts as an answered call, the improvement may be entirely definitional. Write the definitions down in lesson 1 precisely so this cannot happen quietly.
- Same segments. Look at the hourly curve, not just the blended figure. A flat total frequently hides a much better 9am and a much worse 4pm, which is a rostering fix rather than a failure.
The first re-measure is usually disappointing and usually wrong. The common cause is that the change took longer to actually happen than anyone recorded, so half the month is measuring the old process. Check when the change genuinely started before concluding it did not work.
- Ordinary month against ordinary month
- Definitions written down before the first measure
- Hourly curve compared, not just the blended total
- Change start date checked before judging the result
- A fortnight after the change, measuring novelty
- Definitions quietly tightened between the two runs
- One blended number hiding a better 9am and a worse 4pm
- A month with a public holiday against one without
Where messaging is part of the change, the evidence for reminders specifically is better than for most front-office interventions. A Cochrane review of mobile phone messaging reminders for healthcare appointments found they improved attendance against no reminder [3]. Worth knowing, and worth noting that it says reminders beat nothing, which is a narrower claim than most vendor material makes of it.
What the result usually shows
Across the practices that complete all eight lessons rather than the first three, the same three findings repeat with enough regularity that you can almost predict them before the counting starts. None of them is exotic, none needs software to uncover, and all three are invisible from the desk itself.
The first is that the uncovered hours are larger than the roster suggests, because lunch, waiting-room duty and diverts are rarely counted. The second is that the 90th percentile answer time is dramatically worse than the median, so the practice's self-image is built on its good hours. The third is that the orphan callbacks from lesson 4 are the single biggest source of patient frustration and appear in no report anywhere.
None of those requires software to find. All three require someone to spend four hours looking, which is why they persist.
There is a fourth finding that only shows up in practices that complete lesson 8, and it is the most useful one. The improvement is almost never where the effort went. A practice spends three months on after-hours cover and finds the biggest single gain came from moving one person's lunch break by forty minutes. That is not an argument against the after-hours work; it is an argument for measuring before choosing, which is the whole point of the preceding seven lessons.
It is also worth setting expectations about the size of the change. Front-office access work produces improvements of a few percentage points against a baseline, repeatedly, not a transformation. A vendor promising a transformation is either selling to a practice with an unusually bad starting position or describing a number that will not survive the like-for-like comparison in lesson 8.
| Finding | How often it appears | Cost to fix |
|---|---|---|
| Uncovered hours larger than the roster suggests | Almost always | Low. Usually a rostering change |
| 90th percentile far worse than the median | Very common | Low to medium, depending on the peak |
| Orphan callbacks invisible in every report | Very common | Low. A queue and a named role |
| After-hours demand larger than assumed | Varies widely | Medium to high. This is the real decision |
Read that last row carefully against your own patience rate from lesson 3. After-hours cover is the only row on the list that costs real money every month, which makes it the one row that deserves the arithmetic rather than the instinct.
It is worth saying what general practice is carrying while you read your own numbers. There were 40,375 GPs in Australia's primary care workforce in 2024 [4], and 71% of GPs now nominate mental health as a leading reason for patient presentations, up ten points since that survey began in 2017 [4]. Longer, more complex consultations are not a front-office problem, but they are the context your phones are ringing into, and they are part of why the middle bucket in lesson 6 is worth taking off a person's desk.
When to stop auditing and change something
There is a failure mode where the audit quietly becomes the work itself. You can always measure one more thing, and measuring feels productive because it produces documents that look like progress. The discipline is knowing which eight figures are enough, and then stopping to act on them.
Stop when you have the eight figures and the one page. That is enough to make a decision with. If you want to understand what the category of tool being sold into this gap actually does before you weigh any of it, the plain-language explainer is the place to start, and the services we offer are described individually rather than as a bundle so you can match them to the specific buckets you found.
The audit is worth repeating annually, or after any change to your hours, your roster, or your phone system. It is not worth repeating quarterly. Nothing in it moves that fast, and a practice that measures its access every three months is generating reports rather than patients.
One last caution about what the eight figures are for. They describe access, which is one part of a patient's experience and not the most important part. A practice that answers every call in nine seconds and then cannot offer an appointment for five weeks has an access problem the phones cannot fix, and pouring effort into the phones will feel like progress while changing nothing a patient would notice.
The figures are worth keeping in one place and carrying forward, because their value compounds. A single month's answer time is a fact about a month. The same figure measured in four consecutive Septembers is a trend, and a trend is the only thing that will tell you whether a change you made two years ago is still working or has quietly decayed back to where it started. Most front-office improvements decay. Almost nobody notices, because almost nobody kept the baseline.
Keep the one page from lesson 7 with the figures rather than filed separately. The rules and the numbers explain each other, and a year from now the person reading them will be someone who was not in any of these conversations. What they need is not a chart. It is a short account of what was measured, what was decided, and what the practice agreed would happen when the phone rings and nobody is free to answer it.
Sources
- Australian Bureau of Statistics, Patient Experiences, 2024-25 financial year, released 18 November 2025abs.gov.au
- Australian Bureau of Statistics, Employee Earnings, August 2025, released 12 December 2025abs.gov.au
- Gurol-Urganci et al., Mobile phone messaging reminders for attendance at healthcare appointments, Cochrane Database of Systematic Reviews (2013)pubmed.ncbi.nlm.nih.gov
- RACGP, General Practice: Health of the Nation 2025, access to general practice careracgp.org.au